> ## Documentation Index
> Fetch the complete documentation index at: https://docs.atomcommerce.io/llms.txt
> Use this file to discover all available pages before exploring further.
# Analytics Overview
> Build custom reports on your Atom Commerce offers and storefront sessions, or start from one of the built-in reports.
Analytics is in **beta**. You'll see a beta badge next to the page title in your dashboard.
Analytics is a self-serve report builder. Instead of a fixed dashboard, you pick a dataset, choose metrics and dimensions, add filters, and Atom Commerce builds the chart and table for you. Saved reports let you and your team come back to them, duplicate them, or tweak them. New explorations remain drafts until you save them.
## Where to find it
Go to **Analytics** in the main menu. You'll land on the reports list, which shows every saved report for your store.
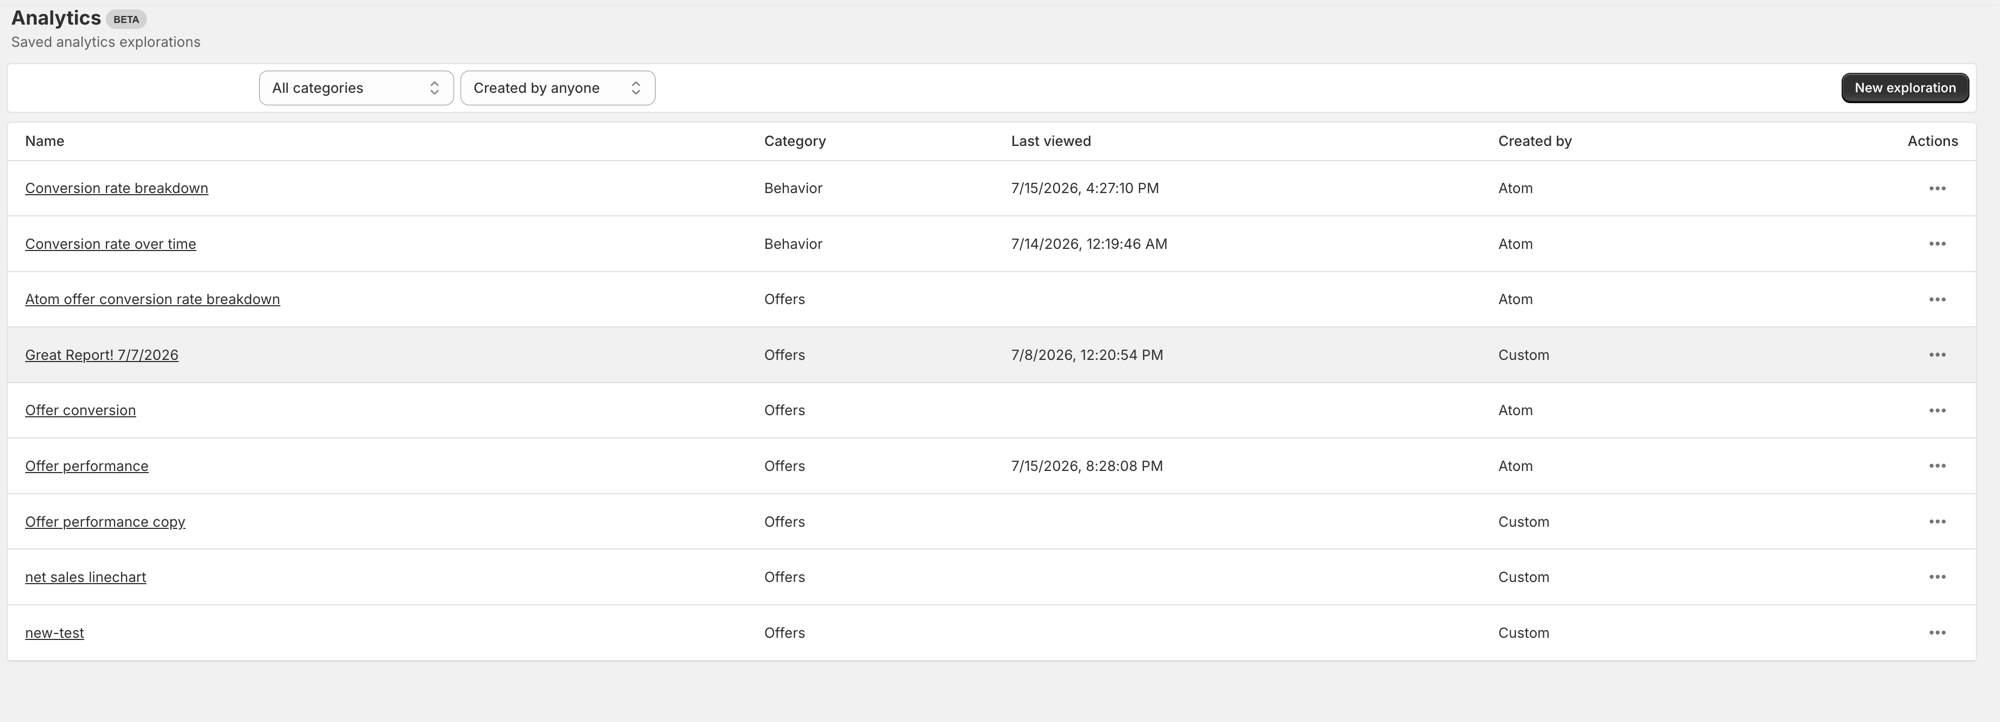 * Filter by **category** (for example, Offers or Behavior) with the category dropdown
* Filter by **creator** — Atom (built-in) or Custom (created by you or your team) — with the "Created by" dropdown
* Click **New exploration** to start a report from scratch
Each row shows the report's name, category, when it was last viewed, and who created it. Open the kebab menu (**...**) on any row to **Duplicate** a report. Custom reports also let you **Rename** or **Delete**; built-in Atom reports don't, since they're shared starting points — duplicate one to make an editable copy.
## The report workspace
Opening a report (or clicking **New exploration**) takes you to the workspace, split into two parts:
* **Results**, on the left: a date-range bar, a **View Technical Query (AtomQL)** accordion showing the underlying query, a headline number for your primary metric, a chart, and a data table.
* **Controls**, on the right: where you configure the dataset, metrics, dimensions, filters, and visualization. Collapse it with the arrow next to the **Controls** heading, or on smaller screens open it as a drawer with **Configure**.
See [Building a Report](/analytics/building-reports) for how to configure each part, and [Key Metrics & Dimensions](/analytics/key-metrics) for what each metric measures.
If you haven't picked any metrics yet, the results panel prompts you to choose one. If your filters or date range don't match any data, it tells you to try widening them.
## Saving your work
Atom Commerce tracks changes to a report and shows a save bar when there's something new to save.
* **New explorations**: use **Save as** to save your draft as a Custom report before you leave the workspace.
* **Custom reports**: click **Save** to update the report in place.
* **Built-in Atom reports**: **Save** is disabled. Use **Save as** to create your own copy with your changes, which then becomes a Custom report you can edit freely.
## Analyzing with Copilot
Open **Atom Copilot** from any report to ask questions about it in plain language, or have it adjust the report for you. See [Analytics Copilot](/analytics/copilot) for what it can see and do.
* Filter by **category** (for example, Offers or Behavior) with the category dropdown
* Filter by **creator** — Atom (built-in) or Custom (created by you or your team) — with the "Created by" dropdown
* Click **New exploration** to start a report from scratch
Each row shows the report's name, category, when it was last viewed, and who created it. Open the kebab menu (**...**) on any row to **Duplicate** a report. Custom reports also let you **Rename** or **Delete**; built-in Atom reports don't, since they're shared starting points — duplicate one to make an editable copy.
## The report workspace
Opening a report (or clicking **New exploration**) takes you to the workspace, split into two parts:
* **Results**, on the left: a date-range bar, a **View Technical Query (AtomQL)** accordion showing the underlying query, a headline number for your primary metric, a chart, and a data table.
* **Controls**, on the right: where you configure the dataset, metrics, dimensions, filters, and visualization. Collapse it with the arrow next to the **Controls** heading, or on smaller screens open it as a drawer with **Configure**.
See [Building a Report](/analytics/building-reports) for how to configure each part, and [Key Metrics & Dimensions](/analytics/key-metrics) for what each metric measures.
If you haven't picked any metrics yet, the results panel prompts you to choose one. If your filters or date range don't match any data, it tells you to try widening them.
## Saving your work
Atom Commerce tracks changes to a report and shows a save bar when there's something new to save.
* **New explorations**: use **Save as** to save your draft as a Custom report before you leave the workspace.
* **Custom reports**: click **Save** to update the report in place.
* **Built-in Atom reports**: **Save** is disabled. Use **Save as** to create your own copy with your changes, which then becomes a Custom report you can edit freely.
## Analyzing with Copilot
Open **Atom Copilot** from any report to ask questions about it in plain language, or have it adjust the report for you. See [Analytics Copilot](/analytics/copilot) for what it can see and do.