> ## Documentation Index
> Fetch the complete documentation index at: https://docs.atomcommerce.io/llms.txt
> Use this file to discover all available pages before exploring further.
# Built-in Analytics Reports
> The five Atom-authored analytics reports available out of the box in Atom Commerce, covering offer performance, offer conversion, and storefront behavior.
Every store starts with five Atom-authored reports. They're read-only, but you can **Duplicate** any of them to create your own editable Custom version. See [Building a Report](/analytics/building-reports) for how to configure a report once you've duplicated it.
 **Category: Offers.** A line chart of Influenced Net Sales by day and offer over the last 30 days, sorted by net sales.
**Category: Offers.** A horizontal bar chart of Atom offer sessions, grouped by offer and currency.
**Category: Offers.** A funnel view of the Atom Offer Sessions dataset, showing how sessions with a specific offer move from cart to completed checkout.
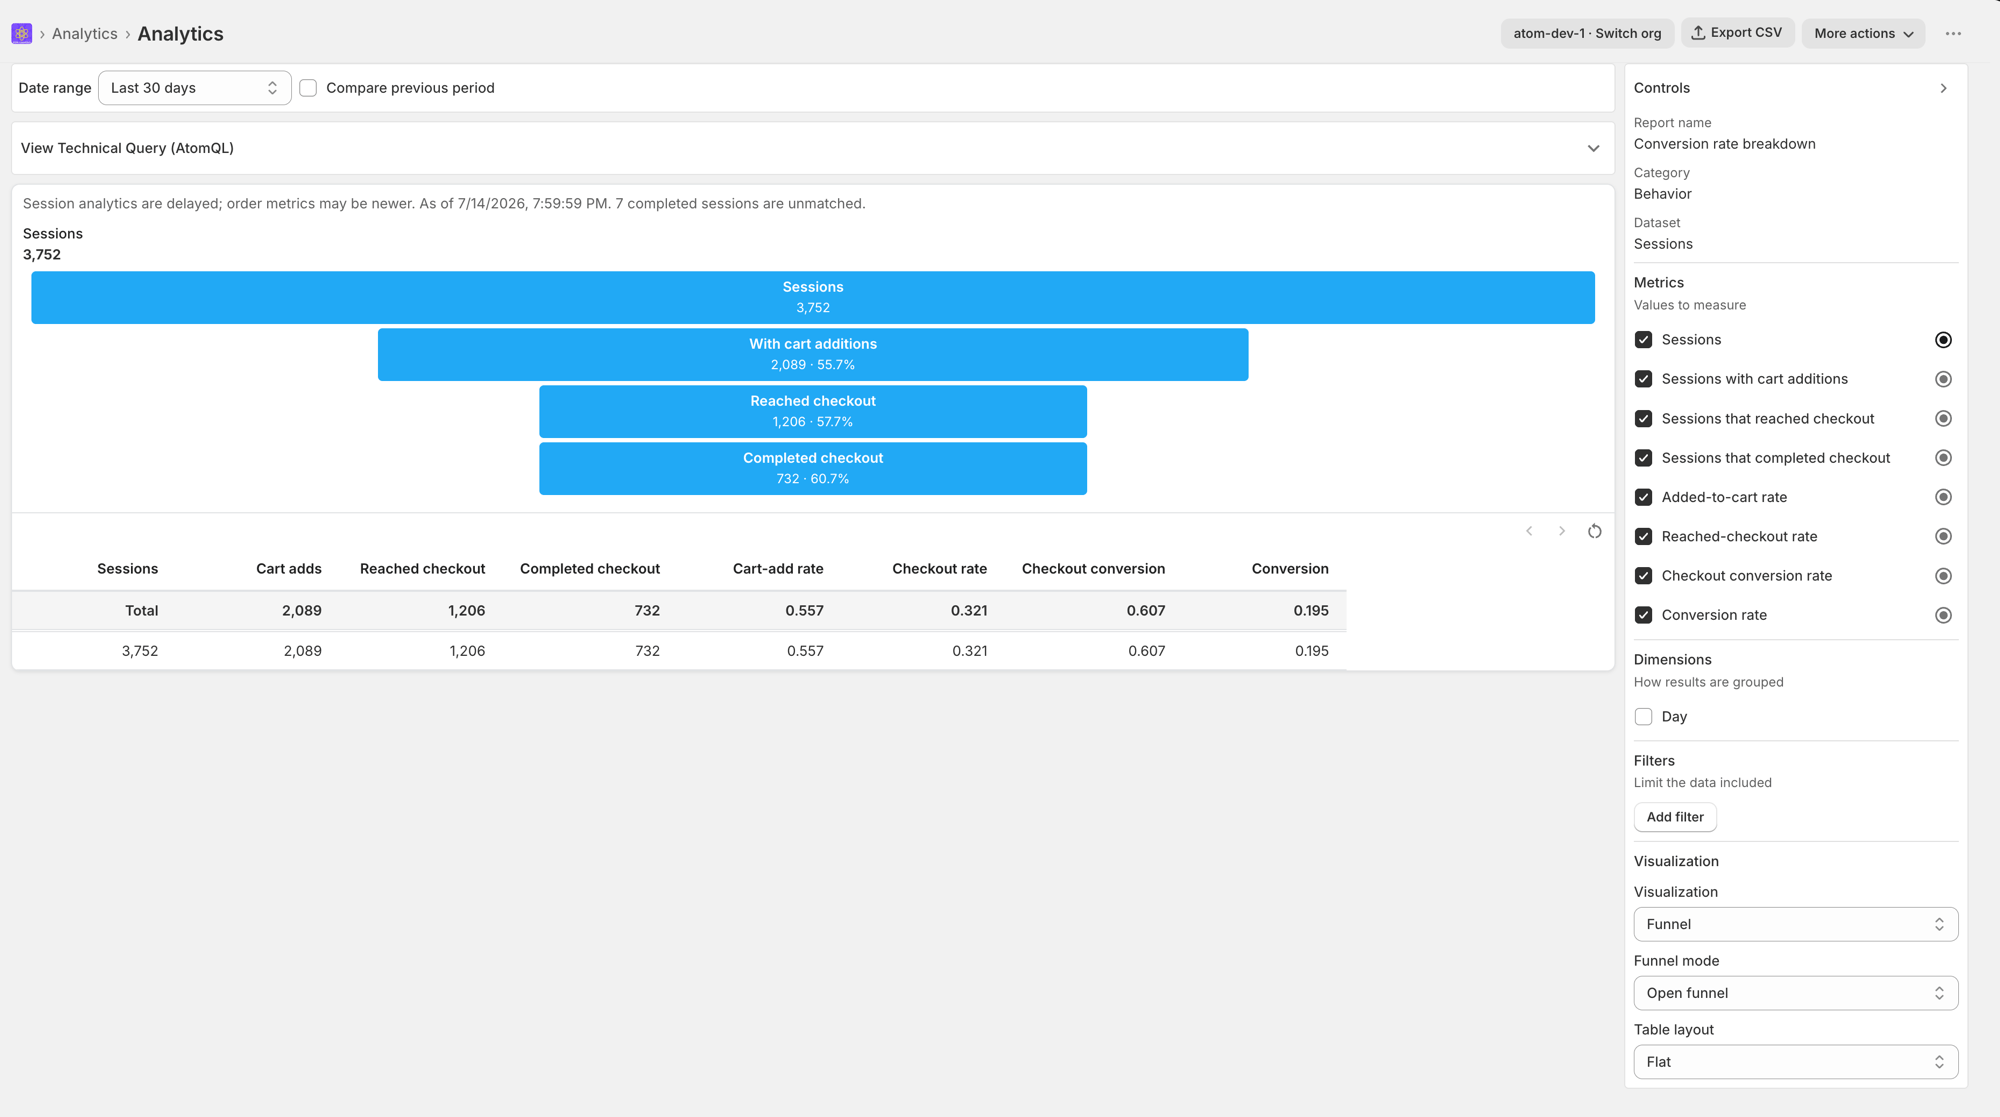
**Category: Behavior.** An open funnel view of all Sessions, from cart addition through completed checkout.
**Category: Behavior.** A line chart of overall conversion rate by day.
Start from the closest built-in report and duplicate it rather than building from scratch — you'll only need to adjust filters or dimensions instead of picking a dataset and metrics from zero.
**Category: Offers.** A line chart of Influenced Net Sales by day and offer over the last 30 days, sorted by net sales.
**Category: Offers.** A horizontal bar chart of Atom offer sessions, grouped by offer and currency.
**Category: Offers.** A funnel view of the Atom Offer Sessions dataset, showing how sessions with a specific offer move from cart to completed checkout.
**Category: Behavior.** An open funnel view of all Sessions, from cart addition through completed checkout.
**Category: Behavior.** A line chart of overall conversion rate by day.
Start from the closest built-in report and duplicate it rather than building from scratch — you'll only need to adjust filters or dimensions instead of picking a dataset and metrics from zero.