> ## Documentation Index
> Fetch the complete documentation index at: https://docs.atomcommerce.io/llms.txt
> Use this file to discover all available pages before exploring further.
# Building an Analytics Report
> Step-by-step guide to building a custom Atom Commerce analytics report: choose a dataset, metrics, dimensions, filters, visualization, and date range.
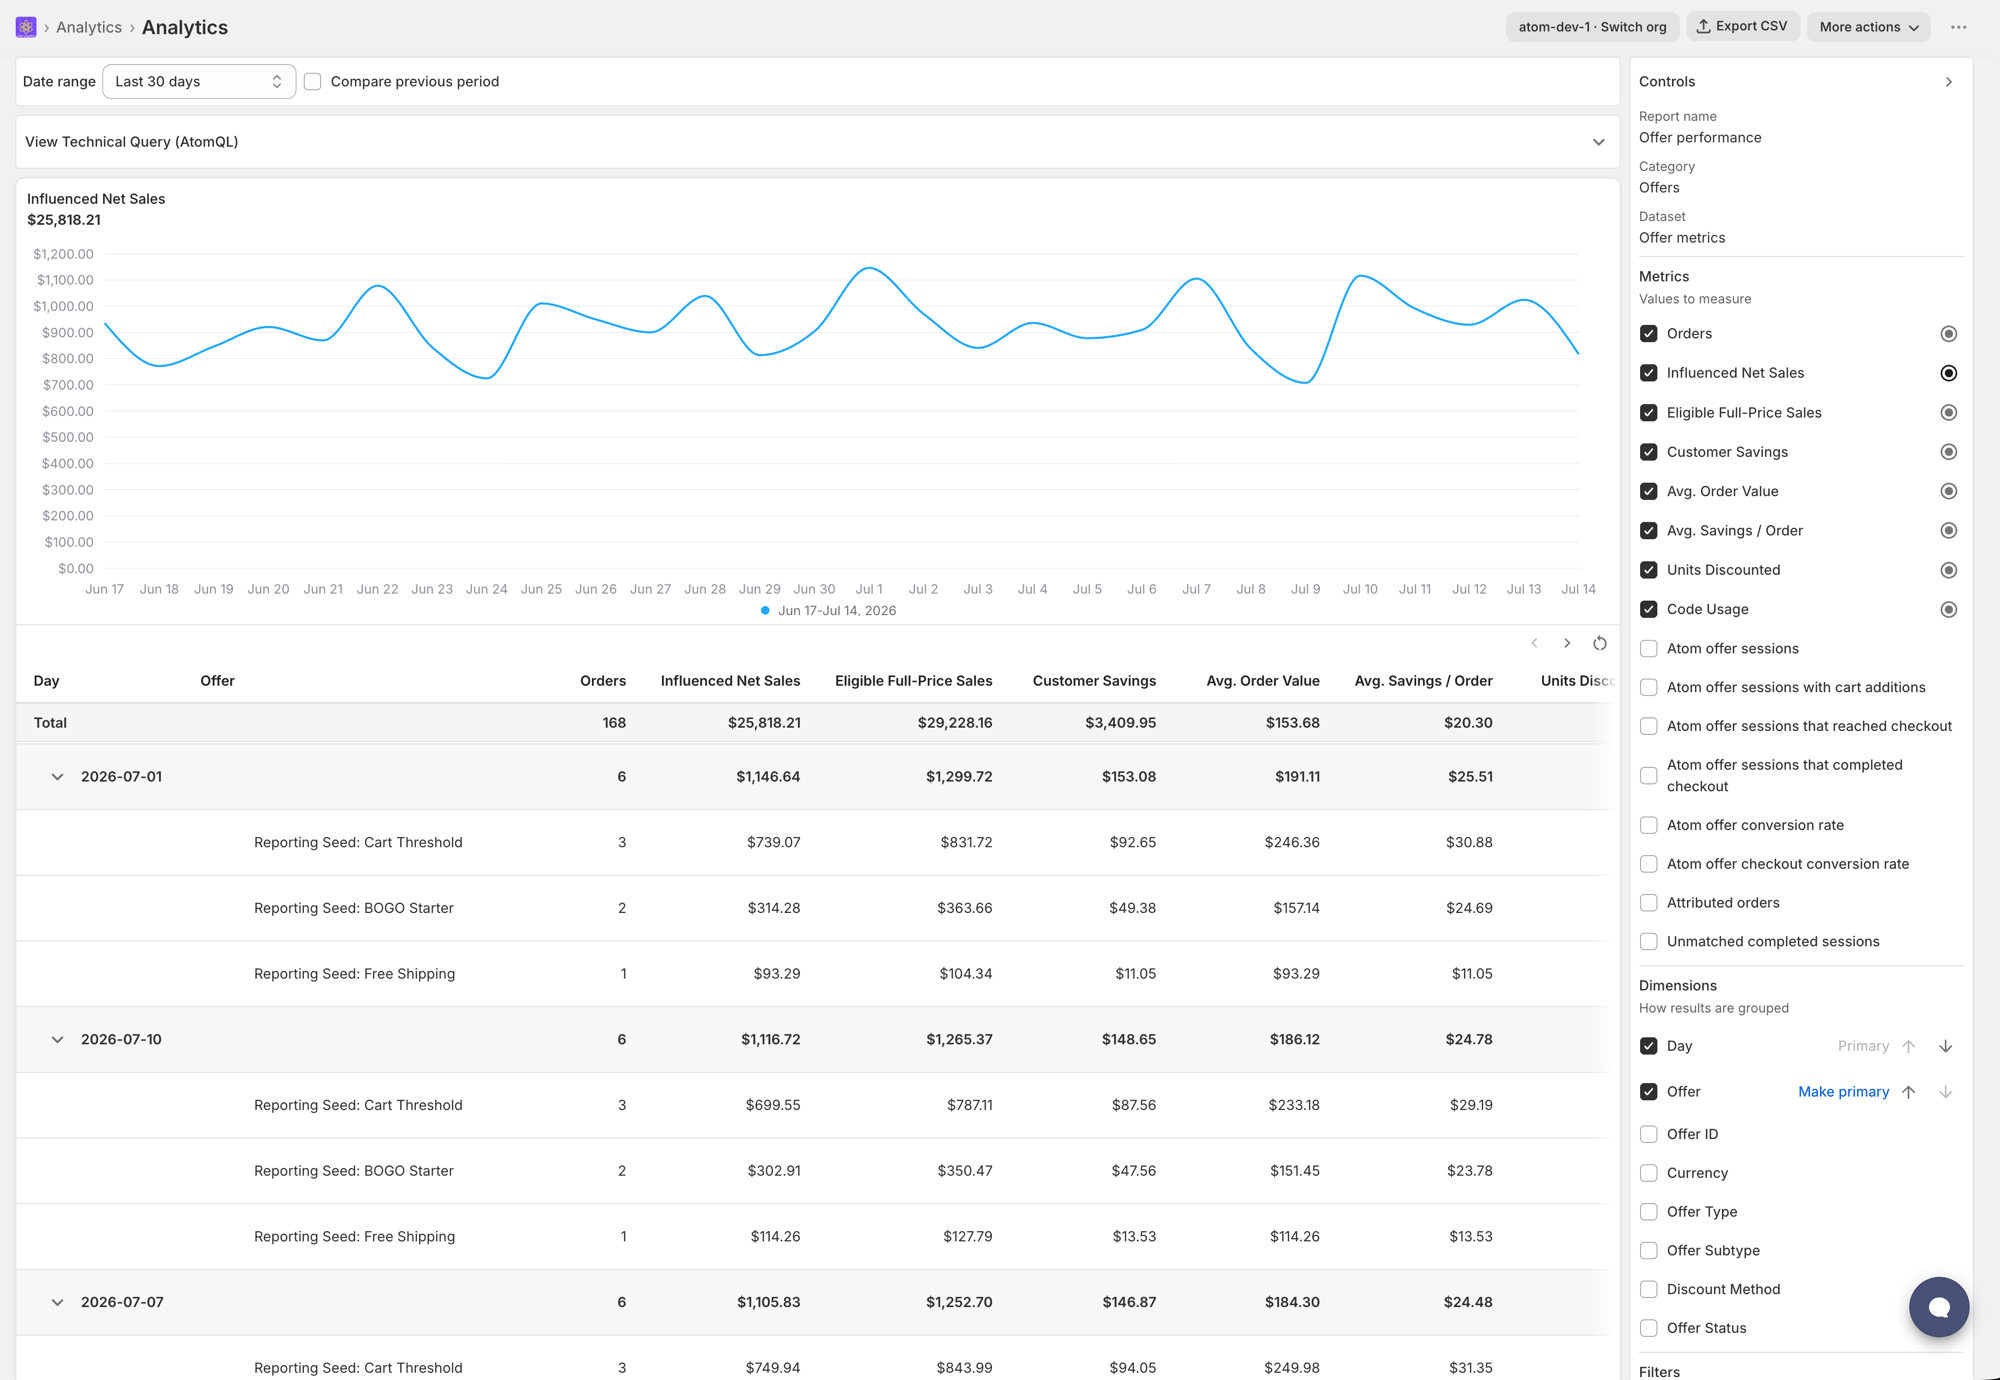
Use the **Controls** panel in the report workspace to configure what a report shows. Open it from any report, or start fresh with **New exploration** from the Analytics reports list.
 Pick **Sessions**, **Atom Offer Sessions**, or **Offer Performance**. This determines which metrics and dimensions are available — see [Key Metrics & Dimensions](/analytics/key-metrics) for the full list.
Check one or more metrics from the list. The metric marked as **primary** drives the headline number at the top of the results and the default chart — select a different metric's radio icon to change which one is primary.
Check a dimension to group your metrics by it, for example **Day** for a trend line or **Offer** to compare offers. Add more than one dimension to build a nested breakdown, and reorder them with the up and down arrows — order matters, since the first dimension is primary and drives the chart and table grouping, with the rest nested underneath it.
Click **Add filter**, then choose a field, operator, and value.
Available operators are **Equals**, **Contains**, **Is any of**, **Is all of**, **Is empty**, and **Is not empty**. **Is all of** is only available when filtering Atom Offer Sessions by offer.
When you filter Atom Offer Sessions by Offer, the value field becomes a searchable dropdown of your offers instead of free text.
Choose **Recommended**, **Line**, **Bar**, **Horizontal bar**, **Funnel**, or **Table**.
**Recommended** picks automatically: a line chart when you're grouping by Day, a horizontal bar chart for other dimensions, or a table when there's no dimension selected.
Choosing **Funnel** adds a **Funnel mode** option — **Open funnel** or **Closed funnel** — available only on the Sessions dataset.
Choose **Auto**, **Flat**, or **Nested** for the data table below the chart. **Nested** only applies when you've selected more than one dimension.
Above the results, choose **Last 7 days**, **Last 30 days**, **Last 90 days**, or a custom start and end date. Check **Compare previous period** to see how each metric changed against the prior equivalent period.
If you change the date range on a saved Custom report, a **Set as default** button appears — click it to make that range the report's default the next time you open it.
## Saving
Click **Save** to update a Custom report in place. For a built-in Atom report, **Save** is disabled — use **Save as** to create your own editable copy instead.
From the reports list, you can also **Duplicate** any report (Atom or Custom), and **Rename** or **Delete** any Custom report.
Pick **Sessions**, **Atom Offer Sessions**, or **Offer Performance**. This determines which metrics and dimensions are available — see [Key Metrics & Dimensions](/analytics/key-metrics) for the full list.
Check one or more metrics from the list. The metric marked as **primary** drives the headline number at the top of the results and the default chart — select a different metric's radio icon to change which one is primary.
Check a dimension to group your metrics by it, for example **Day** for a trend line or **Offer** to compare offers. Add more than one dimension to build a nested breakdown, and reorder them with the up and down arrows — order matters, since the first dimension is primary and drives the chart and table grouping, with the rest nested underneath it.
Click **Add filter**, then choose a field, operator, and value.
Available operators are **Equals**, **Contains**, **Is any of**, **Is all of**, **Is empty**, and **Is not empty**. **Is all of** is only available when filtering Atom Offer Sessions by offer.
When you filter Atom Offer Sessions by Offer, the value field becomes a searchable dropdown of your offers instead of free text.
Choose **Recommended**, **Line**, **Bar**, **Horizontal bar**, **Funnel**, or **Table**.
**Recommended** picks automatically: a line chart when you're grouping by Day, a horizontal bar chart for other dimensions, or a table when there's no dimension selected.
Choosing **Funnel** adds a **Funnel mode** option — **Open funnel** or **Closed funnel** — available only on the Sessions dataset.
Choose **Auto**, **Flat**, or **Nested** for the data table below the chart. **Nested** only applies when you've selected more than one dimension.
Above the results, choose **Last 7 days**, **Last 30 days**, **Last 90 days**, or a custom start and end date. Check **Compare previous period** to see how each metric changed against the prior equivalent period.
If you change the date range on a saved Custom report, a **Set as default** button appears — click it to make that range the report's default the next time you open it.
## Saving
Click **Save** to update a Custom report in place. For a built-in Atom report, **Save** is disabled — use **Save as** to create your own editable copy instead.
From the reports list, you can also **Duplicate** any report (Atom or Custom), and **Rename** or **Delete** any Custom report.